
Rust spoils me, I rarely need to reach for a debugger thanks to structured logging via tracing and errors with spantraces thanks to eyre. When I do find myself wanting to really dig my grubby little paws into some code, configuring the debugger targets can feel intimidating.
Experience has taught me that I can conquer intimidating things though, and sometimes that is best done with a little help. While hacking on a pgx bug, I realized I was using a newly installed system, and needed to reconfigure my debugger settings.
This made a good opportunity for me to share with you! This short article will cover how to configure Visual Studio Code with CodeLLDB so you can visually debug your pgx extensions. This includes being able to step into the pgx or postgres sources. While the instructions may be Arch Linux specific, they should be able to be adapted to a different Linux.
Brief setup
Before we start, set the following sysctl to ensure you can actually do a debug as a non-root user:
cat <<-EOF | sudo tee /etc/sysctl.d/10-ptrace.conf
    kernel.yama.ptrace_scope = 0
EOF
Now, the base packages we need:
sudo pacman -S git base-devel rustup lldb
rustup install stable
rustup default set stable
If you haven't already, setup yay or another AUR helper:
mkdir -p ~/git/Jguer
cd !$
git clone https://aur.archlinux.org/yay.git
cd yay
$EDITOR PKGBUILD
makepkg -si
Next, install the Microsoft branded Visual Studio Code (visual-studio-code-bin) from the AUR. (The Open Source build, code doesn't have the extensions we need.)
Don't be brash, read the
PKGBUILDs whichyayshows you, ensure you are comfortable with them. Do this every time, no matter what.
yay -S visual-studio-code-binLet's install some extensions, rust-analyzer, CodeLLDB, C/C++, and Hex Editor:
code \
    --install-extension rust-lang.rust-analyzer \
    --install-extension vadimcn.vscode-lldb \
    --install-extension ms-vscode.cpptools \
    --install-extension ms-vscode.hexeditor
We'll then pull the PostgreSQL sources locally and build them into a result directory:
mkdir -p ~/git/postgres/postgres
cd !$
git clone git@github.com:postgres/postgres.git
cd postgres
git checkout REL_14_STABLE
echo "result" >> .gitignore
./configure --prefix `pwd`/result --enable-debug
make
make install
Now let's clone the pgx sources locally and install from there:
mkdir -p ~/git/tcdi/pgx
cd !$
git clone git@github.com:tcdi/pgx.git
cd pgx
# Checkout a specific revision if desired.
cargo install --path cargo-pgx --debug
cargo pgx init --pg14 ~/git/postgres/postgres/result/bin/pg_config
Finally, we'll create an extension to explore with and open up code:
mkdir -p ~/tmp/
cd !$
cargo pgx new debuggable
cd !$
code .
Update the default PostgreSQL version feature. Edit the Cargo.toml's [features] block to have:
# debuggable/Cargo.toml
# ...

[features]
default = ["pg14"]

# ...
Our current code window has the debuggable extension open, we're going to make a 'Workspace' with pgx in the same window.
Hit Ctrl+Shift+P (That is -- hold down the Control key while then holding the Shift key, then also the P key, releasing them afterward) then enter into the command pallette add folder to workspace and ensure the picked selection is indeed the option: Workspaces: Add folder to workspace....
In this file chooser, select the ~/git/tcdi/pgx folder we cloned earlier.
Do the same with ~/git/postgres/postgres.
At this point, consider saving the workspace via the "File" menu.
Debugging the SQL generation process
While it's (hopefully) unlikely you'll encounter bugs with the SQL generation process of pgx, let's cover that first.
pgx's SQL generation occurs via cargo-pgx's schema subcommand, usually invoked via the cargo pgx schema call. The cargo-pgx binary will call cargo to build the library, dlopen a postmaster 'mock', inspect the symbols which the various pgx macros generator, then invoke the symbols to gather metadata. Finally, it feeds that metadata into the pgx_utils::sql_entity_graph::PgxSql generator.
Macro expansion
As far as I am aware, there isn't a good way to hook up lldb to a running proc macro.
The best info I could find was in 'Testing Proc Macros' and "Debugging tips".
If you happen to know of a way, please email me! I'll give you credit in this section.
Instead, you will likely rely on cargo expand:
cargo install cargo-expandNow you can use cargo expand on the entire extension (with no args), or select specific symbols to expand:
[ana@architect debuggable]$ cargo expand hello_debuggable
    Checking debuggable v0.0.0 (/home/ana/tmp/debuggable)
    Finished dev [unoptimized + debuginfo] target(s) in 0.22s

fn hello_debuggable() -> String {
    let val = String::from("Hello, ");
    let postfix: String = Spi::get_one("SELECT 'Debuggable'").unwrap();
    val + &postfix
}
Note that pgx macros will generate other symbols to expand, too. Typically #[pg_extern] macros produce a $FUNCNAME_wrapper function which is what PostgreSQL calls:
[ana@architect debuggable]$ cargo expand hello_debuggable_wrapper
Checking debuggable v0.0.0 (/home/ana/tmp/debuggable)
Finished dev [unoptimized + debuginfo] target(s) in 0.22s
#[]
#[()]
unsafe extern "C" fn hello_debuggable_wrapper(fcinfo: pg_sys::FunctionCallInfo) -> pg_sys::Datum {
#[()]
#[()]
#[()]
#[(::)]
#[(::)]
unsafe fn hello_debuggable_wrapper_inner(fcinfo: pg_sys::FunctionCallInfo) -> pg_sys::Datum {
let result = { hello_debuggable() };
result.into_datum().unwrap_or_else(|| {
::core::panicking::panic_fmt(::core::fmt::Arguments::new_v1(
&["returned Datum was NULL"],
&[],
))
})
}
pg_sys::guard::guard(|| hello_debuggable_wrapper_inner(fcinfo))
}For SQL generation, most macros will also produce like a __pgx_internals_TYPE_FUNCNAME:
[ana@architect debuggable]$ cargo expand __pgx_internals_fn_hello_debuggable
Checking debuggable v0.0.0 (/home/ana/tmp/debuggable)
Finished dev [unoptimized + debuginfo] target(s) in 0.22s
#[]
#[()]
pub extern "C" fn __pgx_internals_fn_hello_debuggable(
) -> ::pgx::utils::sql_entity_graph::SqlGraphEntity {
use core::any::TypeId;
extern crate alloc;
use alloc::vec::Vec;
use alloc::vec;
let submission = ::pgx::utils::sql_entity_graph::PgExternEntity {
name: "hello_debuggable",
unaliased_name: "hello_debuggable",
schema: None,
file: "src/lib.rs",
line: 5u32,
module_path: "debuggable",
full_path: "debuggable::hello_debuggable",
extern_attrs: ::alloc::vec::Vec::new(),
search_path: None,
fn_args: ::alloc::vec::Vec::new(),
fn_return: ::pgx::utils::sql_entity_graph::PgExternReturnEntity::Type {
id: TypeId::of::<String>(),
source: "String",
full_path: core::any::type_name::<String>(),
module_path: {
let type_name = core::any::type_name::<String>();
let mut path_items: Vec<_> = type_name.split("::").collect();
let _ = path_items.pop();
path_items.join("::")
},
},
operator: None,
to_sql_config: ::pgx::utils::sql_entity_graph::ToSqlConfigEntity {
enabled: true,
callback: None,
content: None,
},
};
::pgx::utils::sql_entity_graph::SqlGraphEntity::Function(submission)
}cargo-pgx's SQL generation
To debug the pgx_utils::sql_entity_graph::PgxSql or cargo-pgx side of SQL generation, you can create a debug configuration in debuggable/.vscode/launch.json with this:
// debuggable/.vscode/launch.json
{
"version": "0.2.0",
"configurations": [
{
"type": "lldb",
"request": "launch",
"name": "SQL Generation",
"terminal": "integrated",
"program": "cargo-pgx",
"args": ["pgx", "schema"],
"sourceLanguages": ["rust", "c"],
},
]
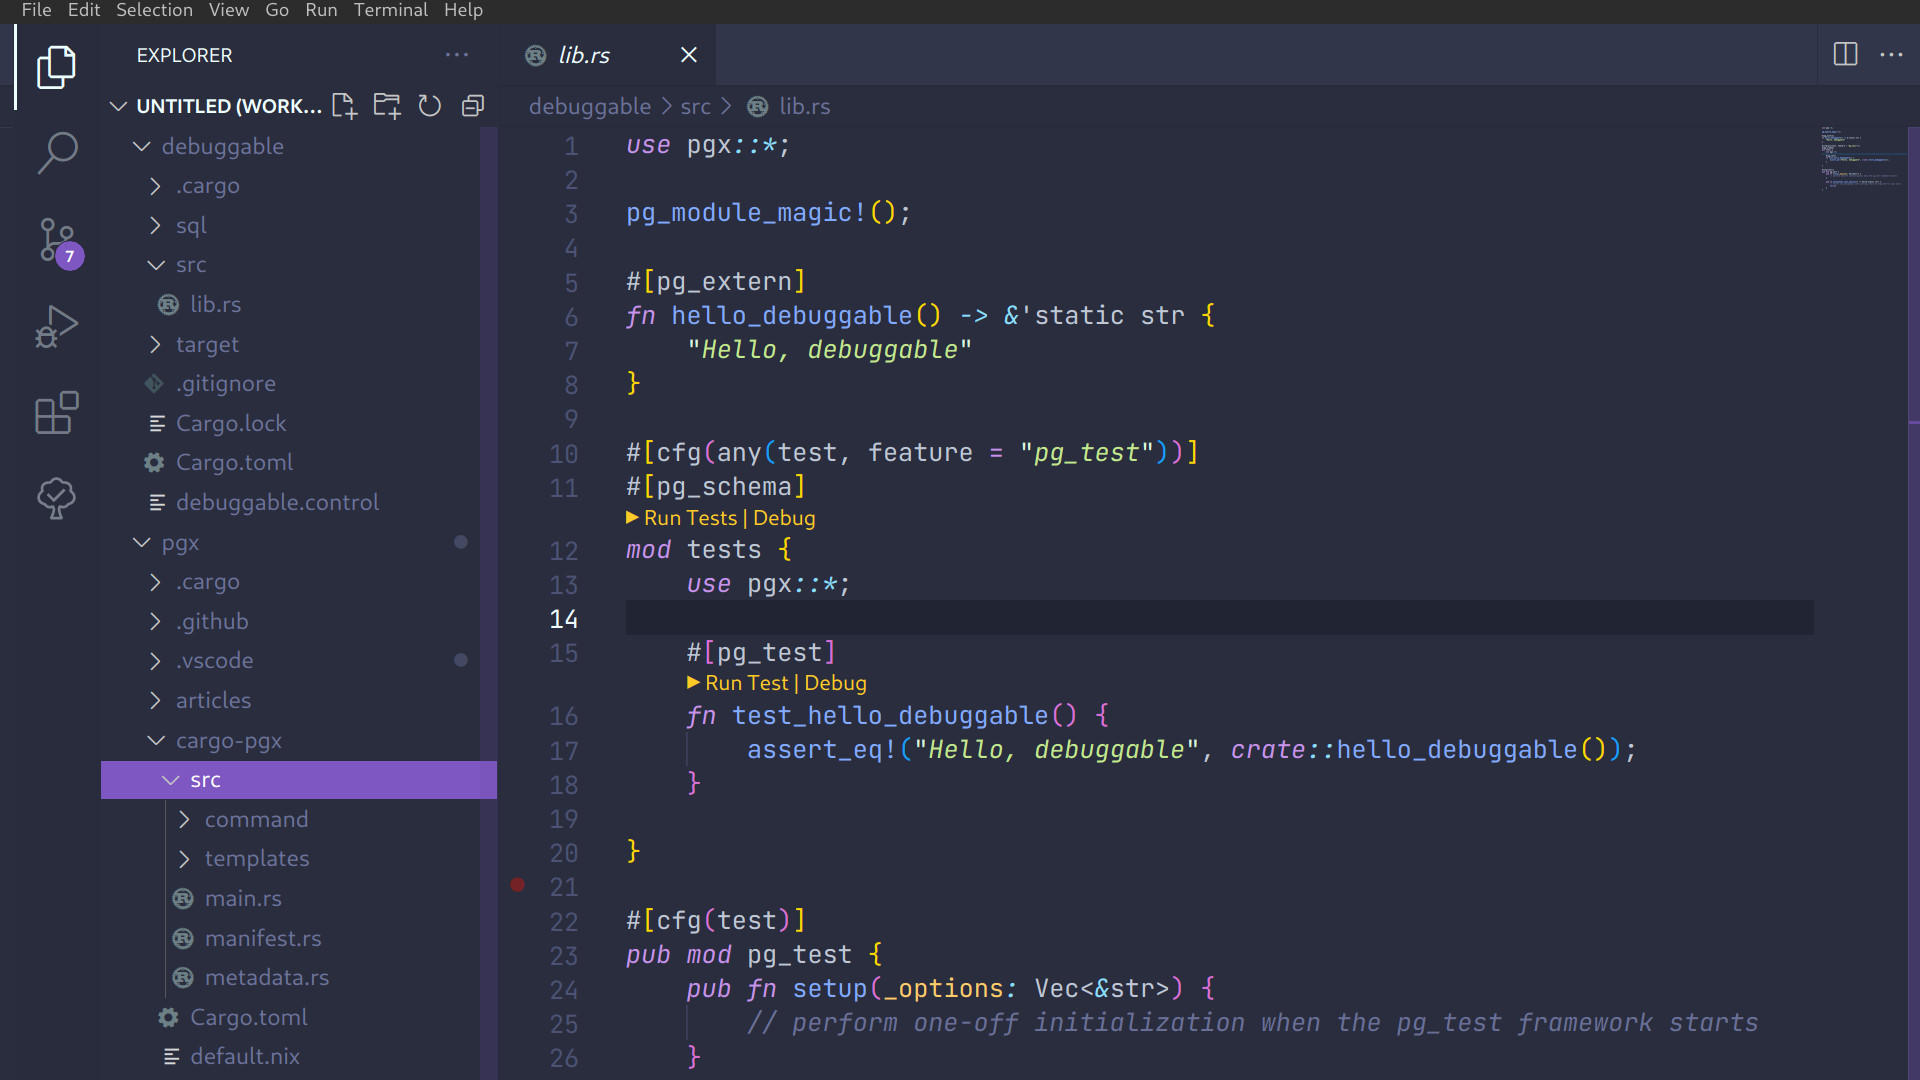
}Navigate over to pgx/pgx_utils/src/sql_entity_graph/pg_extern/mod.rsand Ctrl+F tracing::trace!(sql = %ext_sql);,, it should be in the to_sql function, click the red dot that appears when you hover to the left of the line number there, and set a breakpoint.
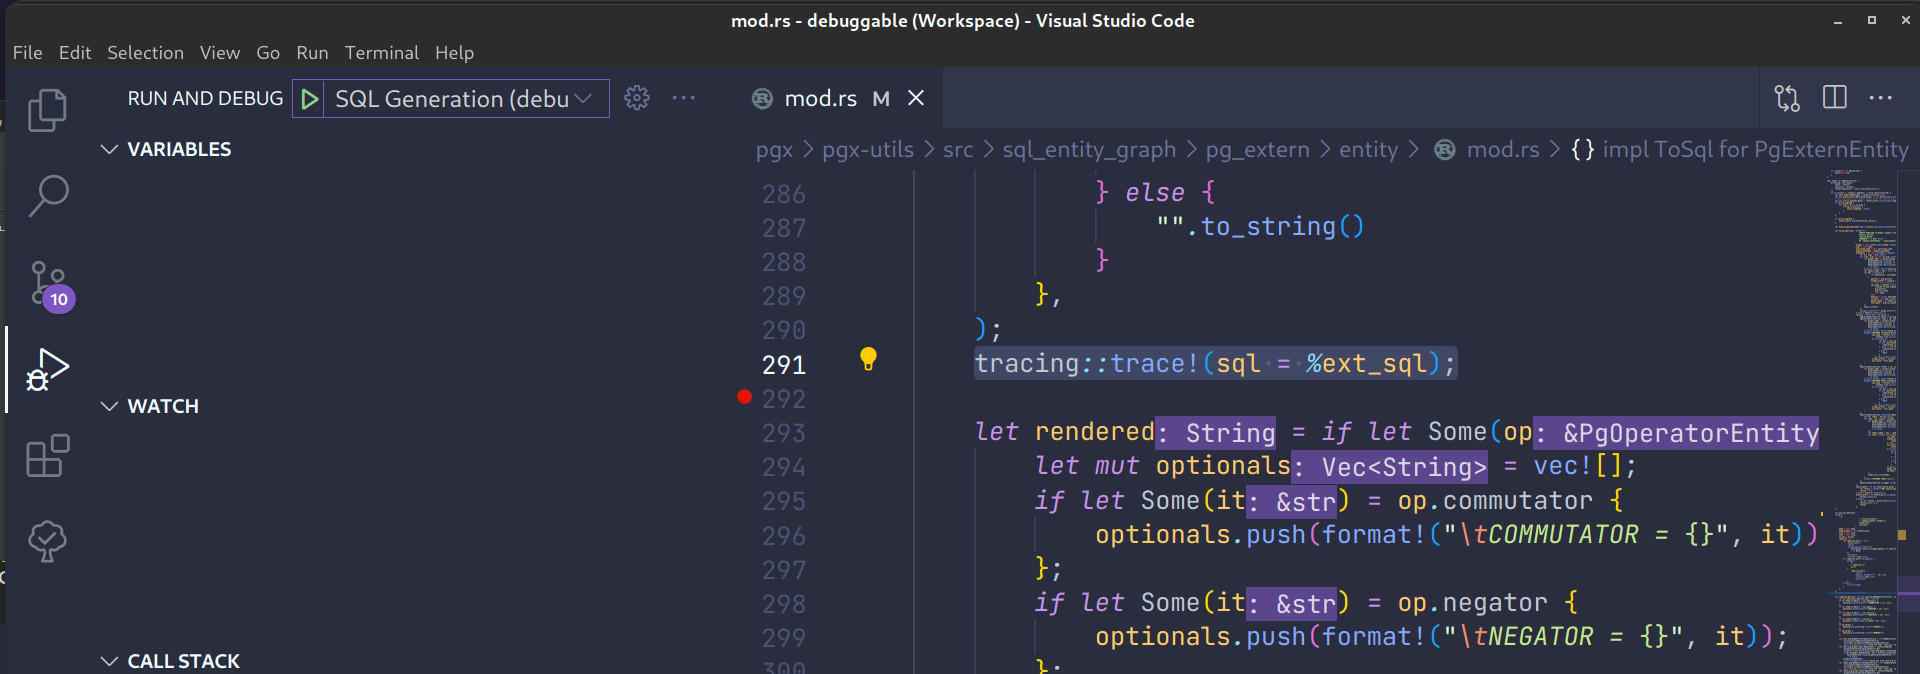
In the "Run & Debug" pane (selected in screenshot above on the left), hit the "Play" button beside "SQL generation" at the top. In a terminal you should see cargo pgx schema get run and begin to process the SQL, it will hit the breakpoint during this process and allow you to inspect and work with it:
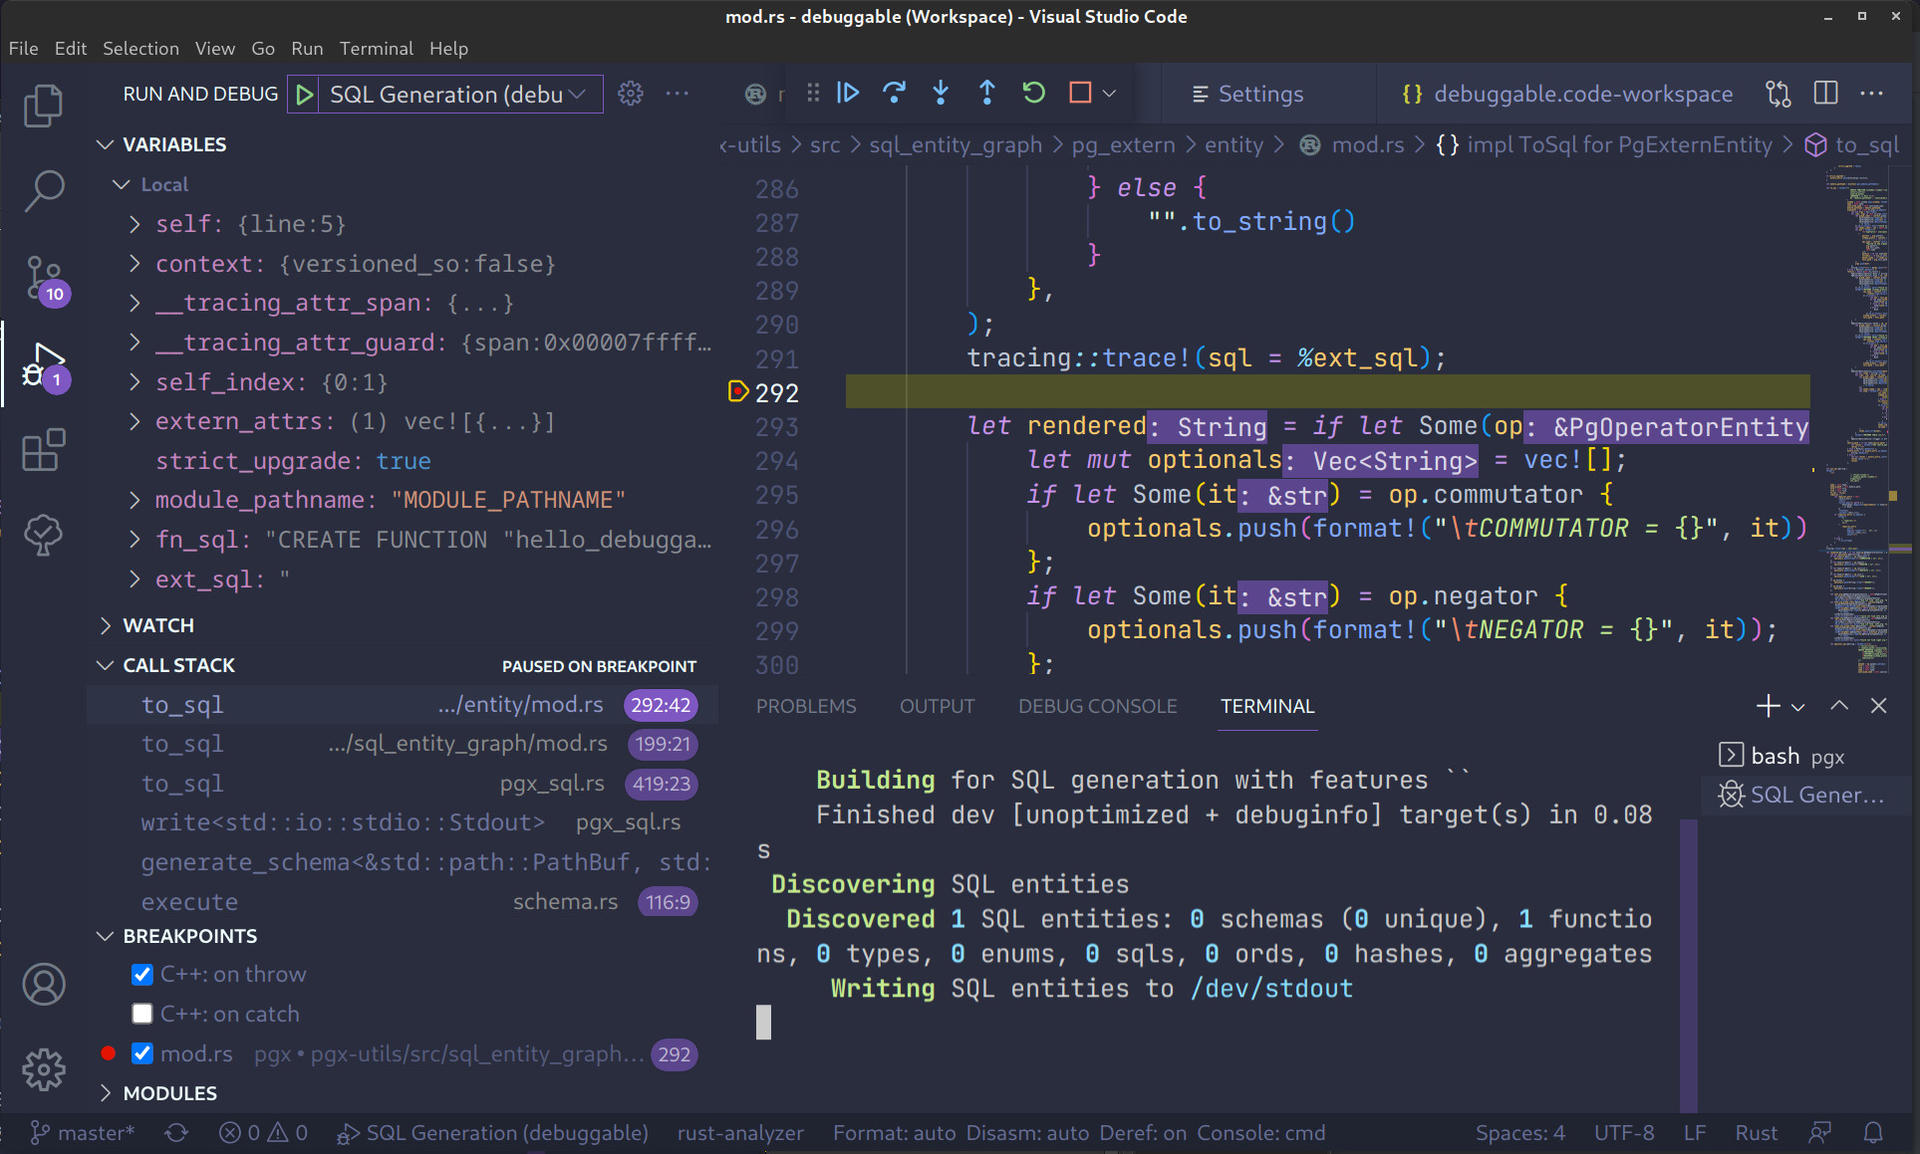
At the top middle of the screenshot above, you can see the 'Continue', 'Step over', 'Step into' and related buttons. To the left side we can see 'Variables', the 'Watch' pane, as well as the call stack which caused us to arrive at a particular position.
Debugging pgx extensions
Debugging running extension code is a little bit different. Let's recall something about how PostgreSQL works:
The PostgreSQL server can handle multiple concurrent connections from clients. To achieve this it starts (“forks”) a new process for each connection. From that point on, the client and the new server process communicate without intervention by the original postgres process. Thus, the supervisor server process is always running, waiting for client connections, whereas client and associated server processes come and go. (All of this is of course invisible to the user. We only mention it here for completeness.)
So PostgreSQL starts a supervisor which then forks a new process each connection. This means, if we're debugging extension, we want to attach to that fork.
CodeLLDB will let us attach to a running process this way, so we'll add a new job to the launch.json:
// debuggable/.vscode/launch.json
{
    "version": "0.2.0",
    "configurations": [
        // Any from before
        {
            "type": "lldb",
            "request": "attach",
            "name": "Attach to existing",
            "pid": "${command:pickProcess}",
            "sourceLanguages": ["rust", "c"]
        },
    ]
}
Then we'll change up the #[pg_extern] function in the code to make it more interesting:
#[]
fn hello_debuggable() -> String {
let val = String::from("Hello, ");
let postfix = String::from("Debuggable"); // Set a break here
val + &postfix
}Set a breakpoint on the highlighted line, then in a terminal run cargo pgx run.
Once you reach a psql prompt:
psql (14.4)
Type "help" for help.

debuggable=#
Select the 'Attach' option from the debugger dropdown. (Where we hit 'SQL Generation' before in the 'Run & Debug' pane.) You should see a postgres process with your extensio name.
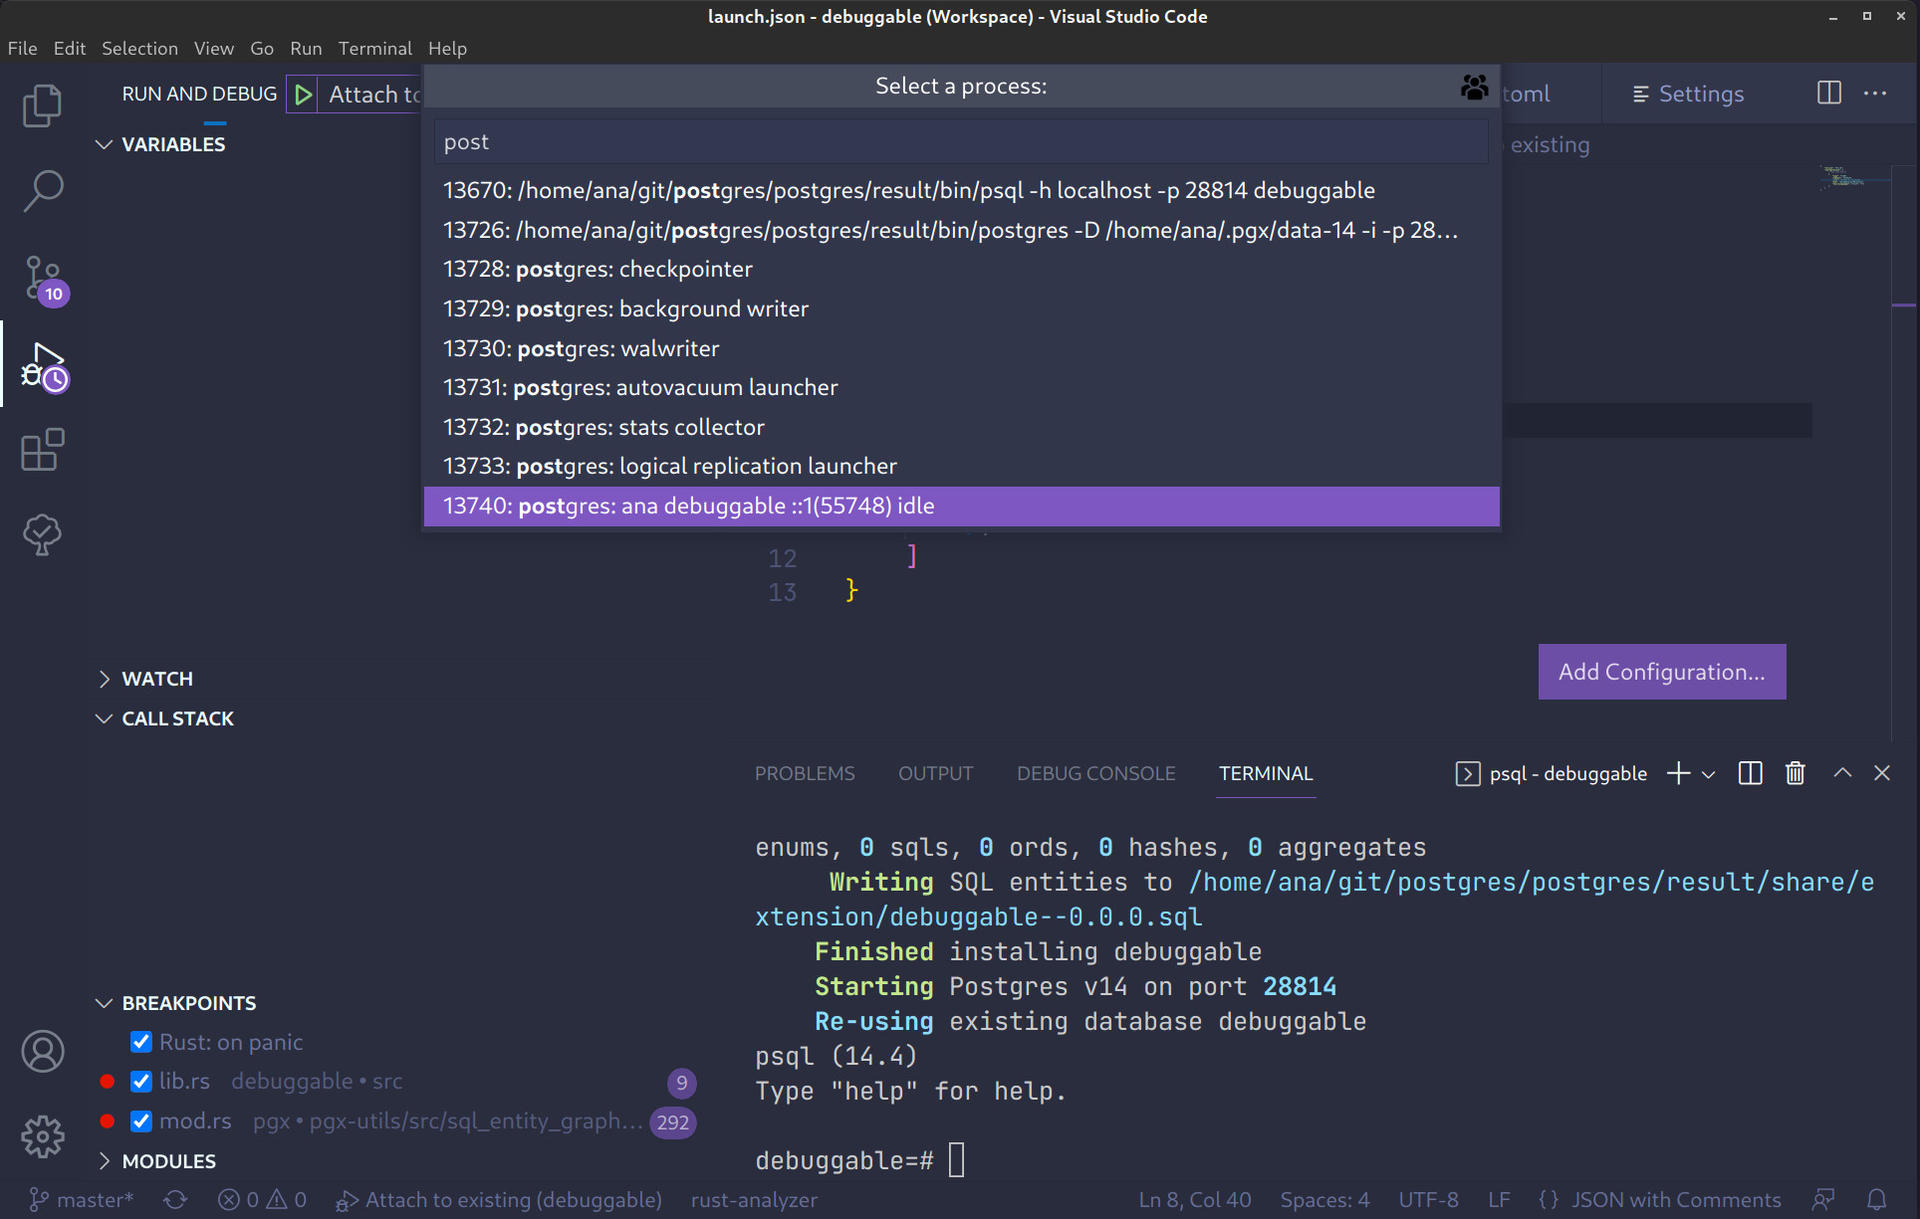
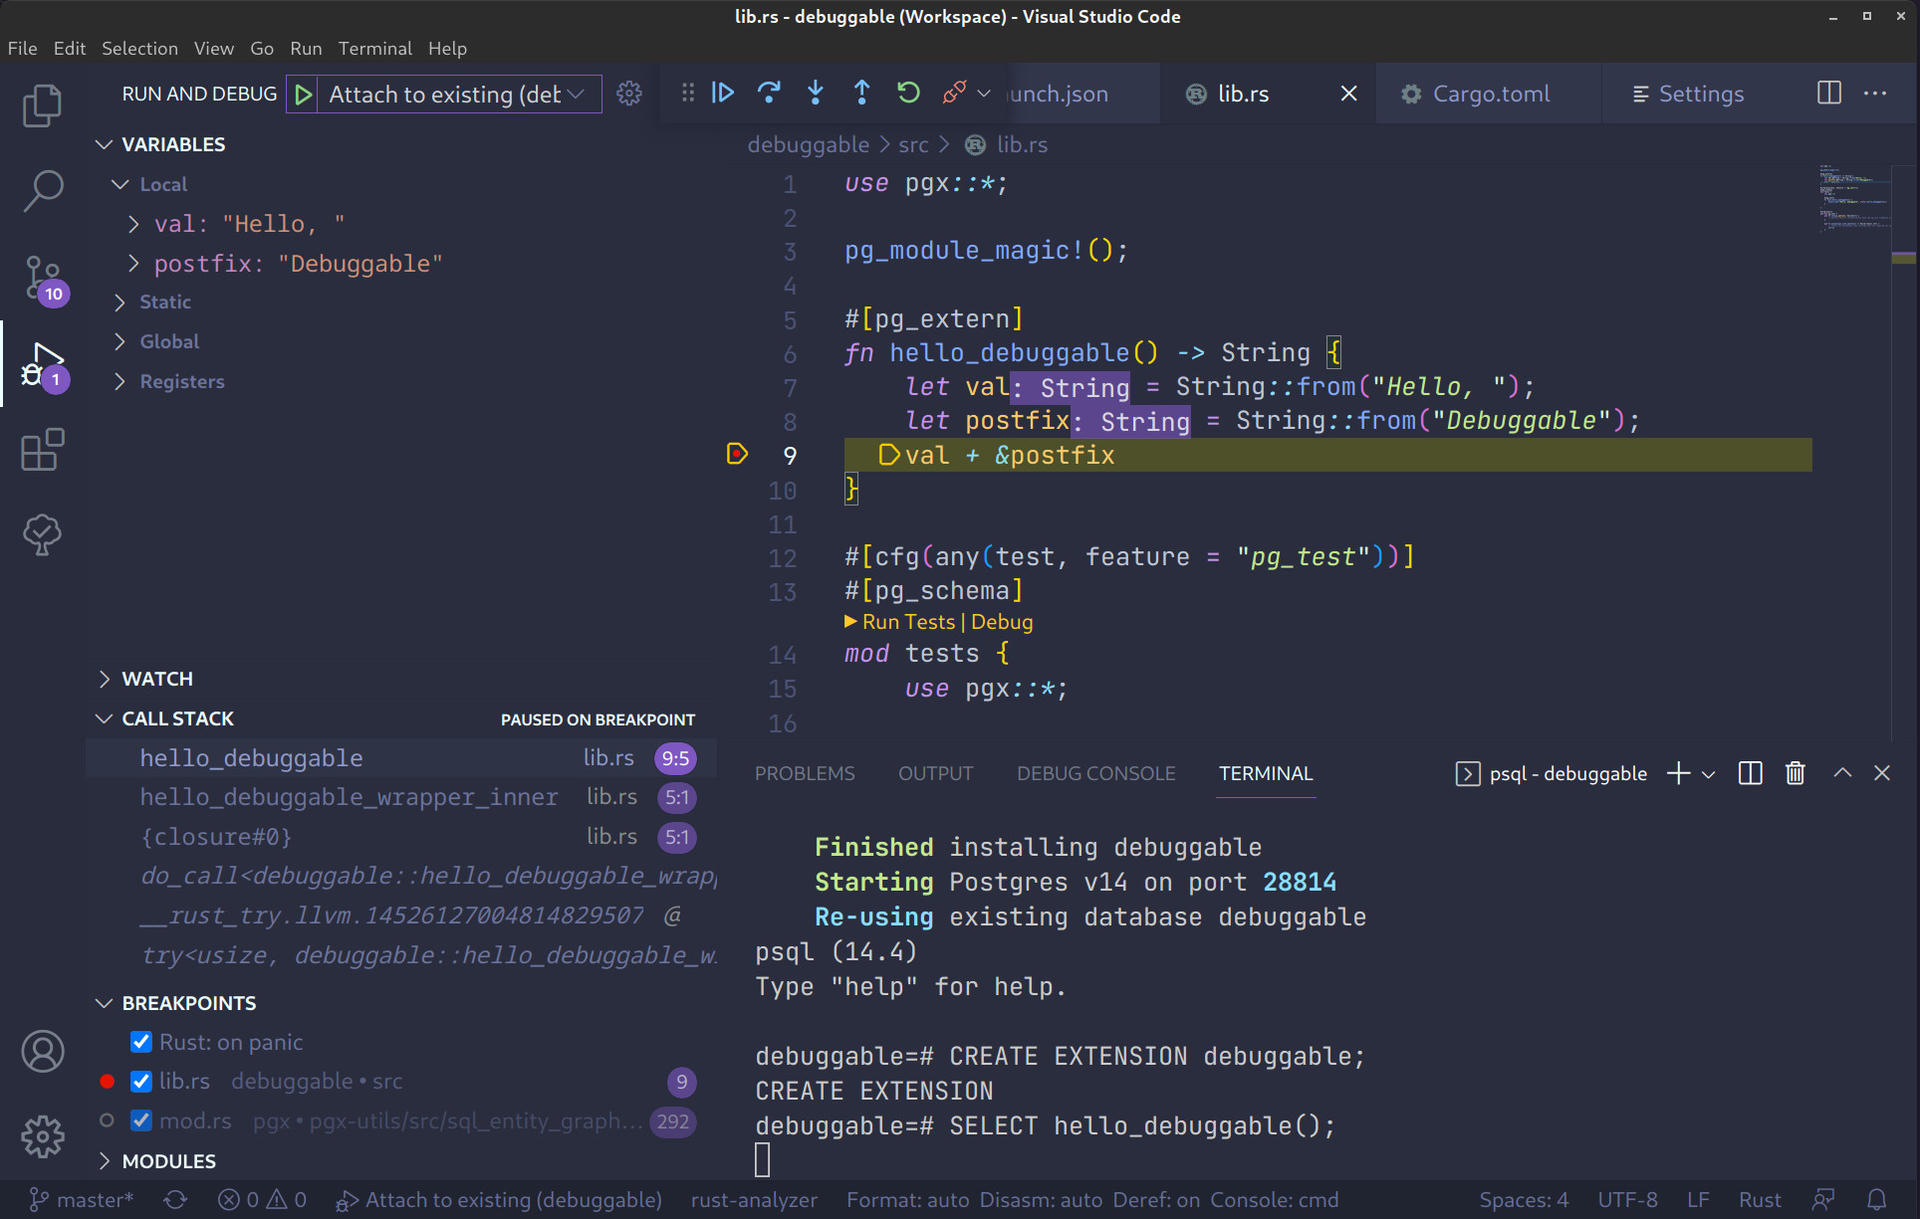
Attaching won't immediately break on anything, but when you start running commands from psql you can trigger breakpoints within the extension:
CREATE EXTENSION debuggable;
SELECT hello_debuggable();
-- Breakpoint hit!!!
On the breakpoint, you'll see that familiar screen again:
Debugging pgx and PostgreSQL code
Having now learnt to debug cargo-pgx and our own extension, how do we debug if code slips inside pgx, or even PostgreSQL?
Let's modify our hello_debuggable to call something over the Server Programming Interface (SPI):
#[]
fn hello_debuggable() -> String {
let val = String::from("Hello, ");
let postfix: String = Spi::get_one("SELECT 'Debuggable'").unwrap(); // Set a breakpoint here!
val + &postfix
}Do a cargo pgx run again, and attach to the process like before. Then in psql:
DROP EXTENSION IF EXISTS debuggable CASCADE; CREATE EXTENSION debuggable;
SELECT hello_debuggable();
Break! Now we're going to 'Step into' this Spi::get_one statement.
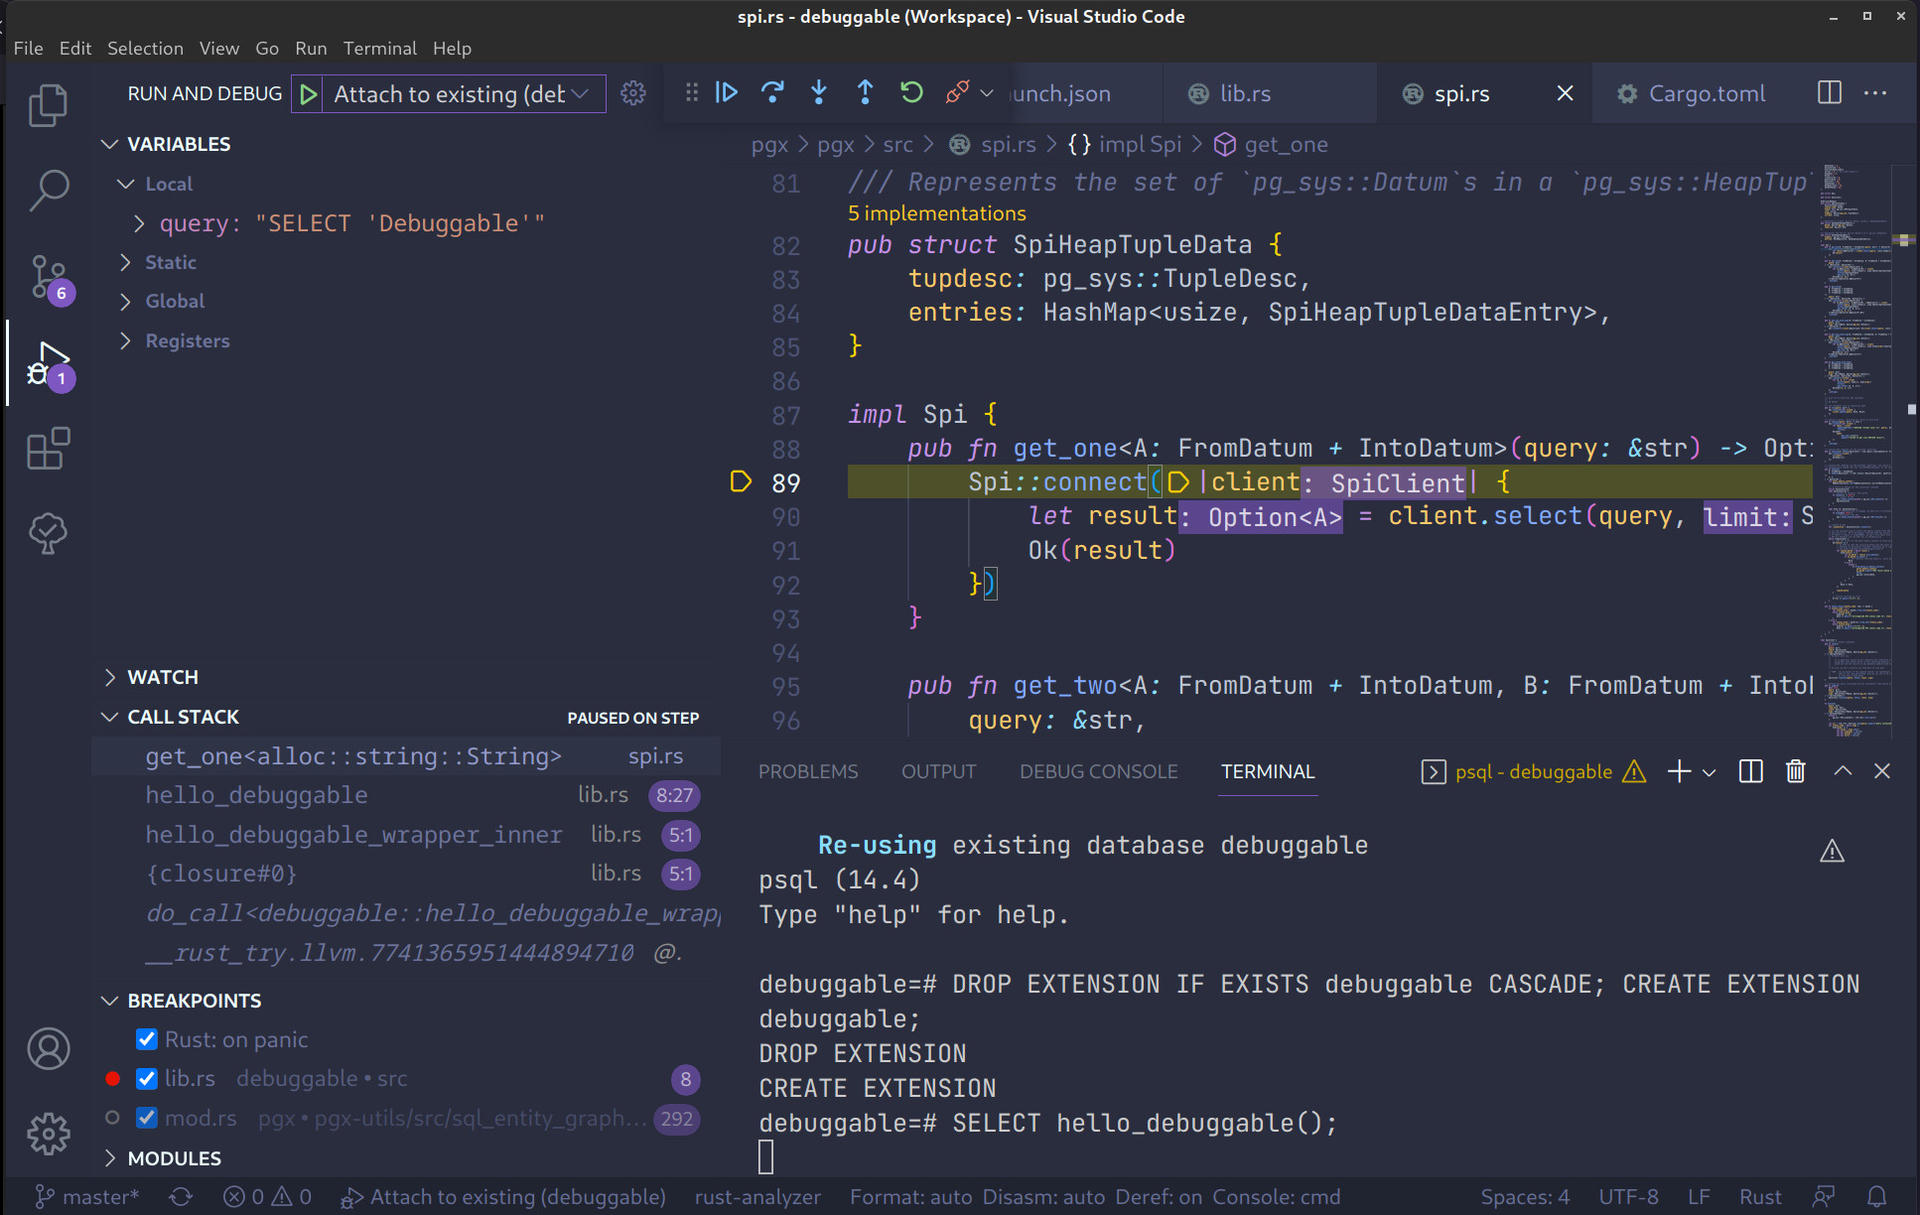
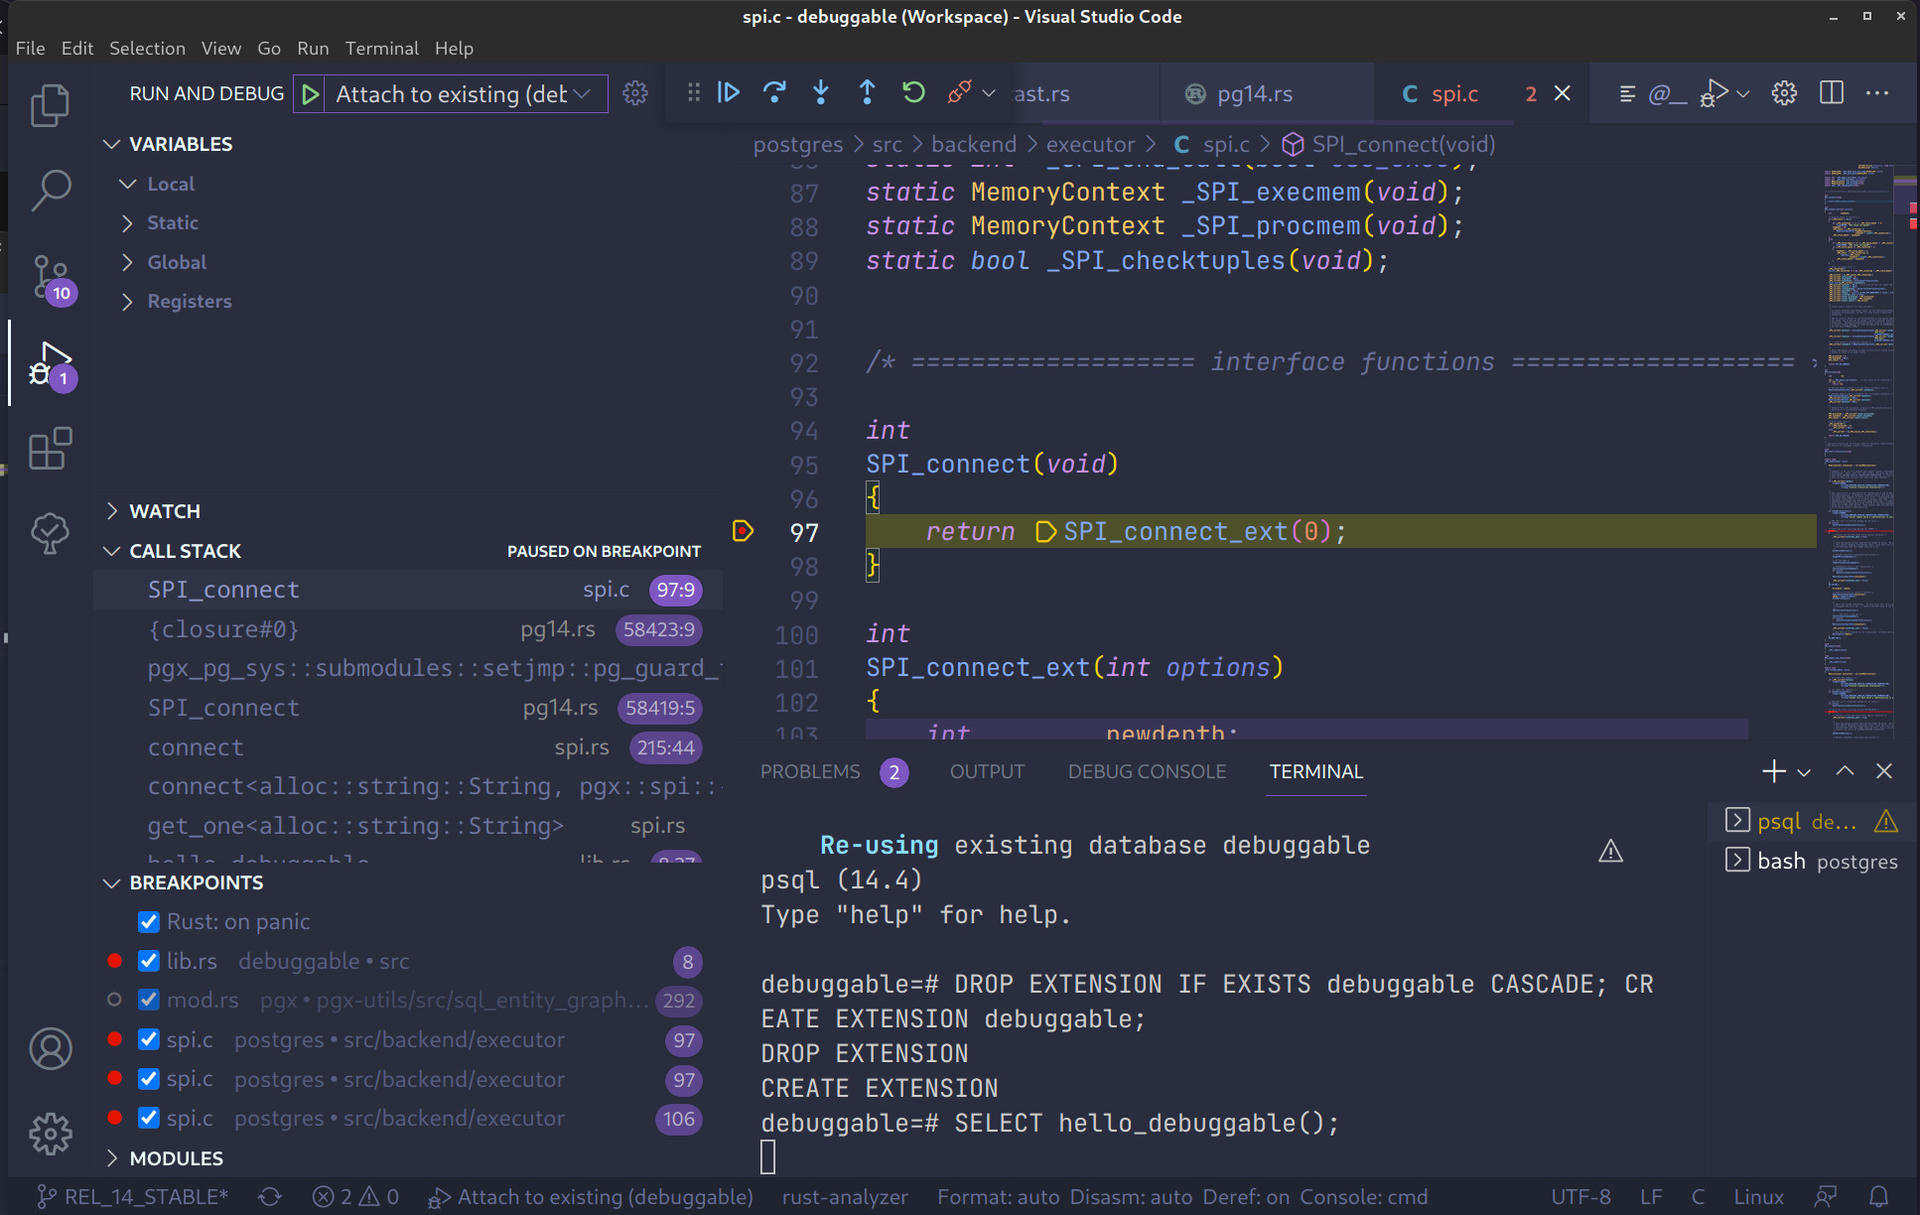
Now, navigate over to postgres/src/backend/executor/spi.c and set a breakpoint on the int SPI_connect(void) function:
int
SPI_connect(void)
{
	return SPI_connect_ext(0); // Set a breakpoint here!
}
Now hit the 'Continue' on the debugger and we should break inside PostgreSQL:
Fantastic, now we can debug almost every part of our pgx extension. That's all for this article today!
I hope you manage to find your bugs! If not, let us know in Discord